


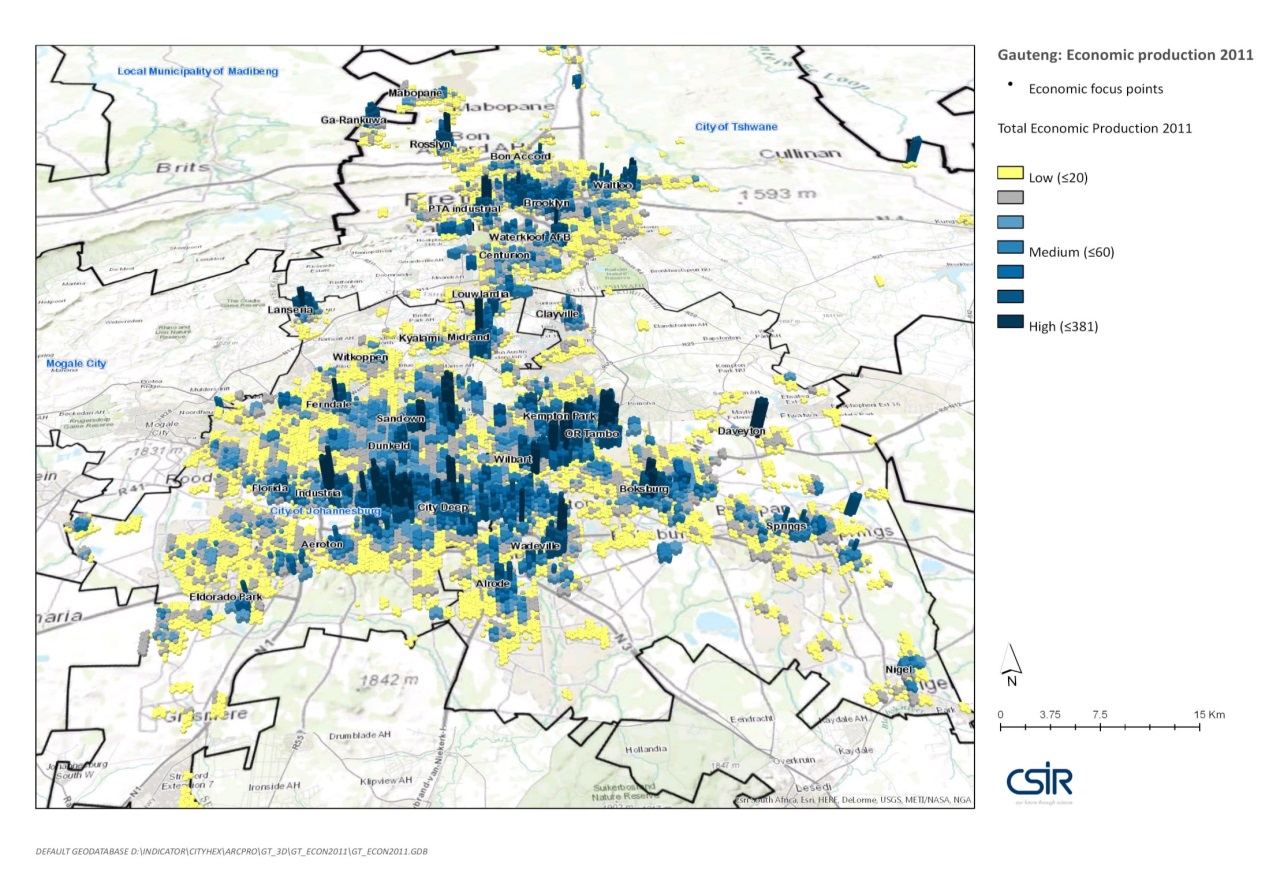
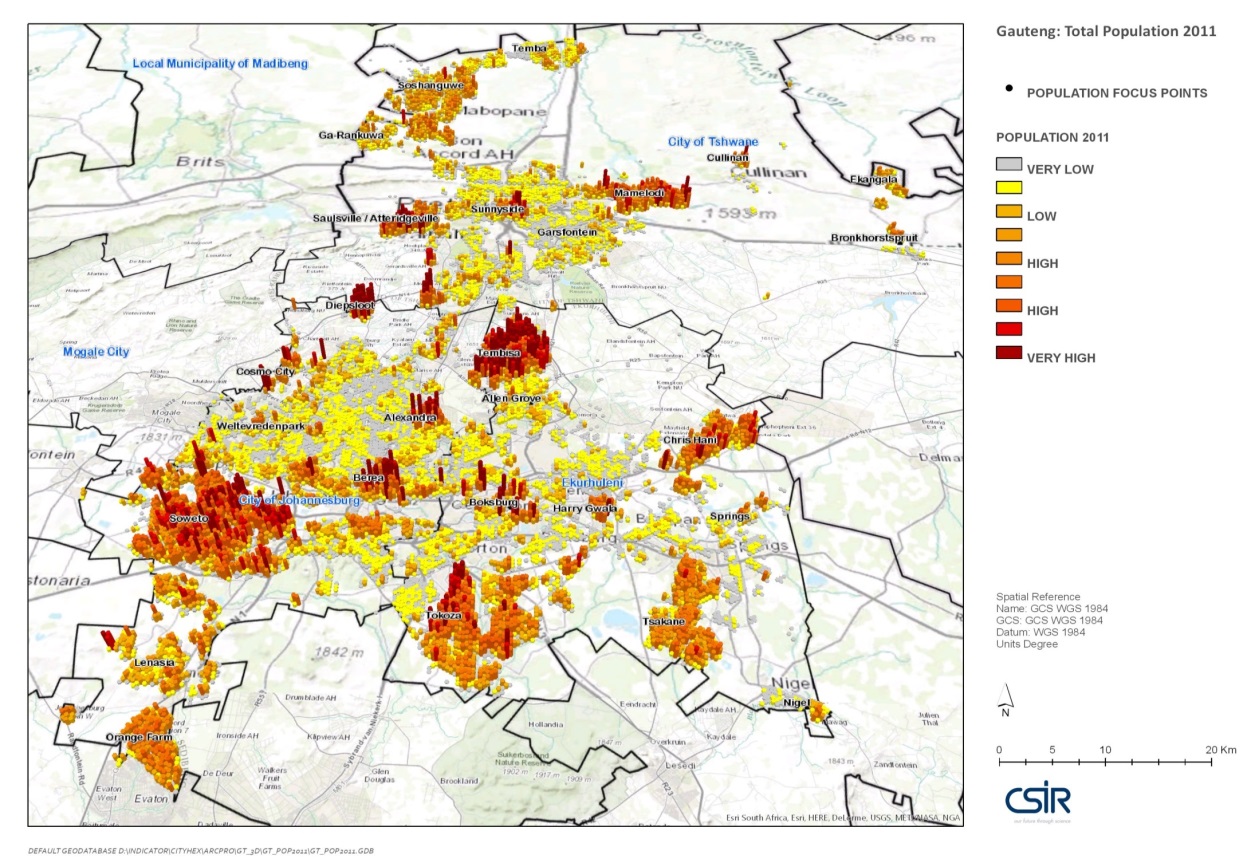
The following illustrates the new three dimensional maps created to depict information using a single sized fine grained tessellation.
Economic Production 2011
Population 2011
Change in Population 1996 - 2011
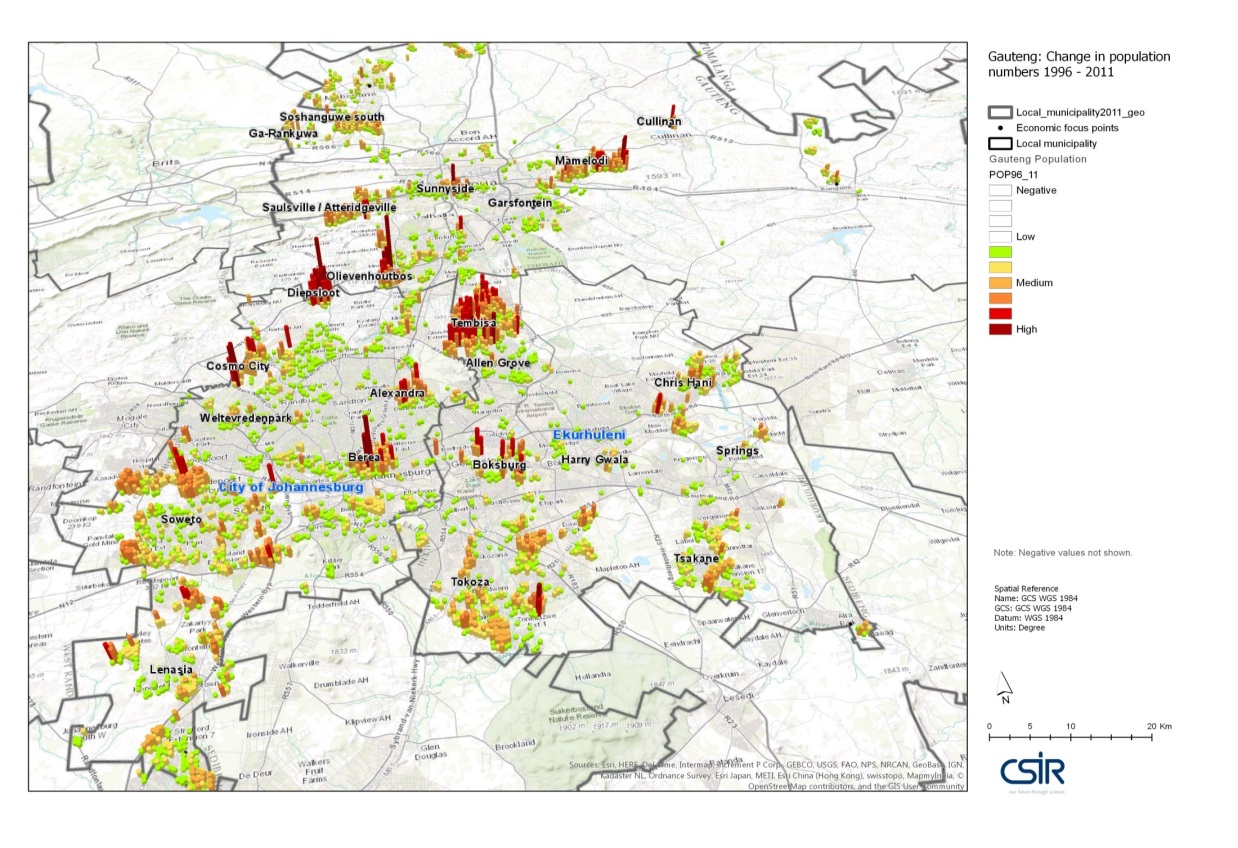
Note: some values near zero are not shown in maps.